
2/8/2022 - Current Water Use Trends Among Cambria Residents
January 2022's precipitation totals have left something to be desired, that's for sure.
Still, Cambria's primary aquifer, the San Simeon Creek Groundwater Basin, reached capacity with the December storms. Water levels there are still looking good, but additional precipitation in February and March is needed to stave off an early start to the dry season and rapid depletion of groundwater storage. In the meantime, are you wondering how Cambrians are doing in terms of efficient use of water? Me, too.
Flume Water Data Insights
The CCSD Flume Smart Water Monitor rebate program has given staff a preview of the power of water analytics. Data from all the Flume devices sold under the CCSD rebate program has been aggregated into daily averages measured as "gallons per capita per day" or GPCD. CCSD Flume rebates were first offered in 2020 and have continued to be provided over three major phases with the most recent winding down now (only 12 remaining!). For a period of time after each rebate phase, Flume provides access to CCSD rebate participant data through their Flume Utility Portal. This allows CCSD staff to view leak alerts, monitor high users, and compare daily and monthly consumption averages.
This morning, I decided to take a look at some consumption data to see how efficiently CCSD customers are using water this year compared to the year prior. Results are shown below.
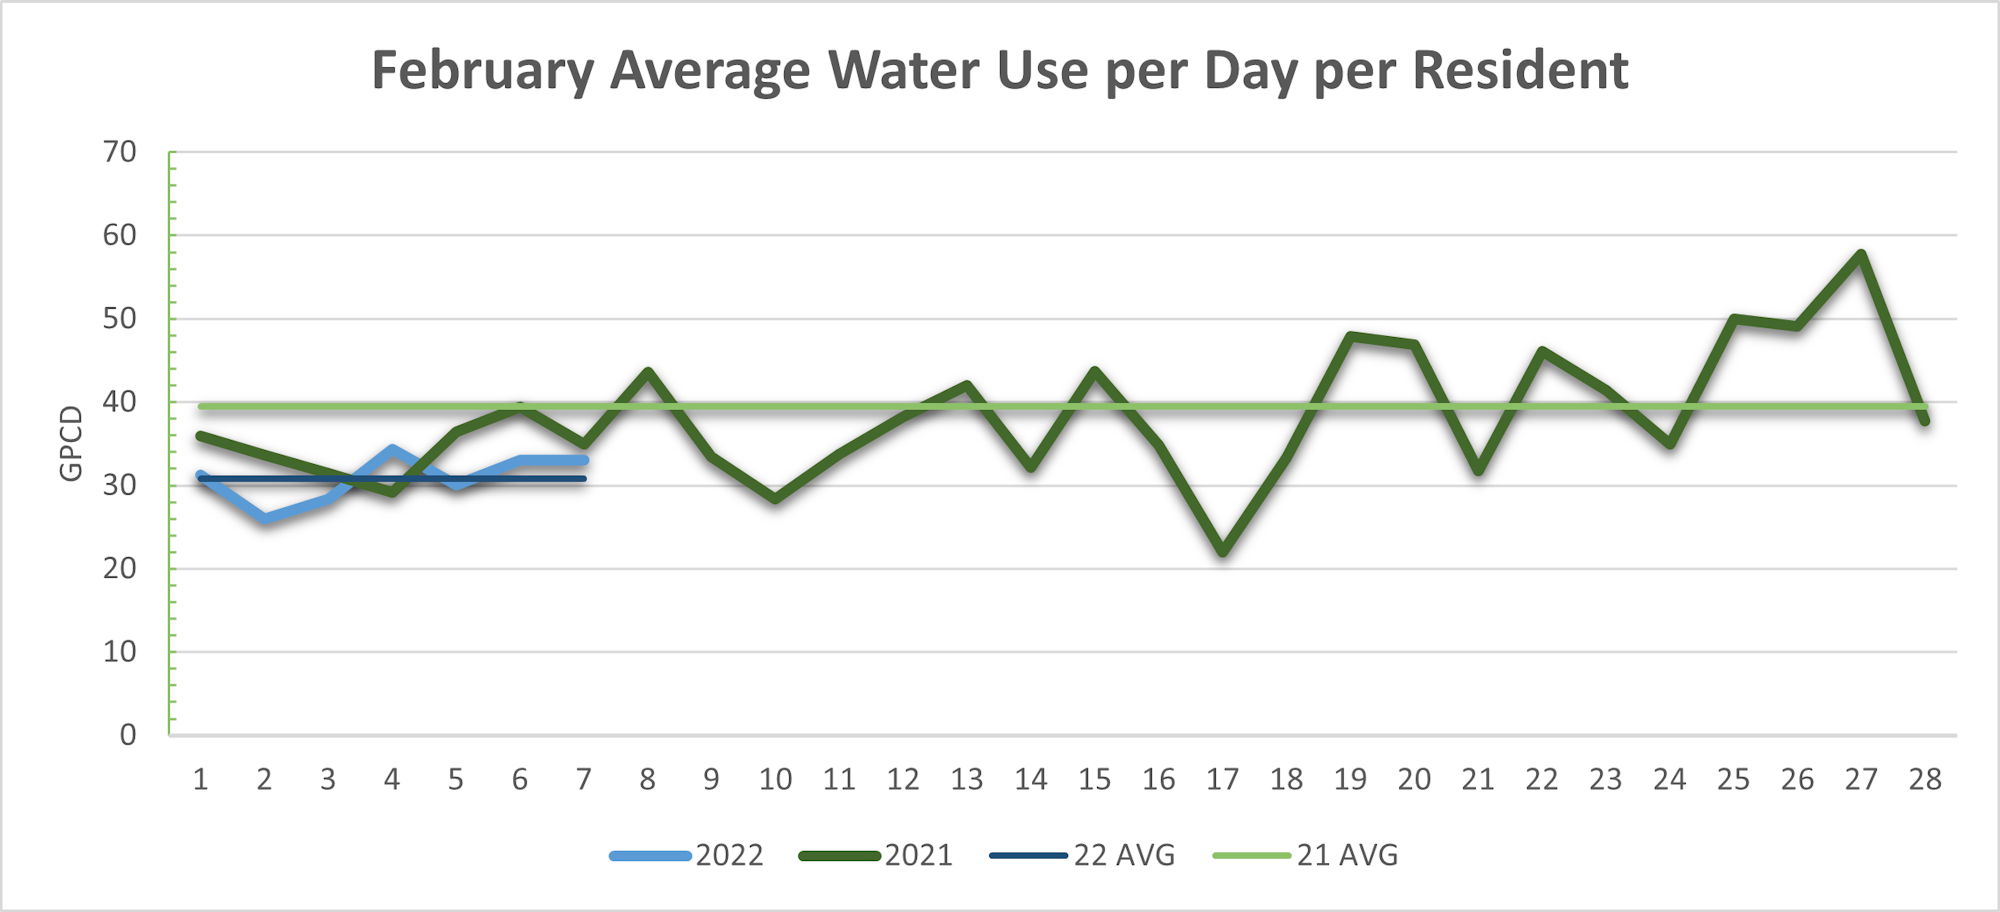
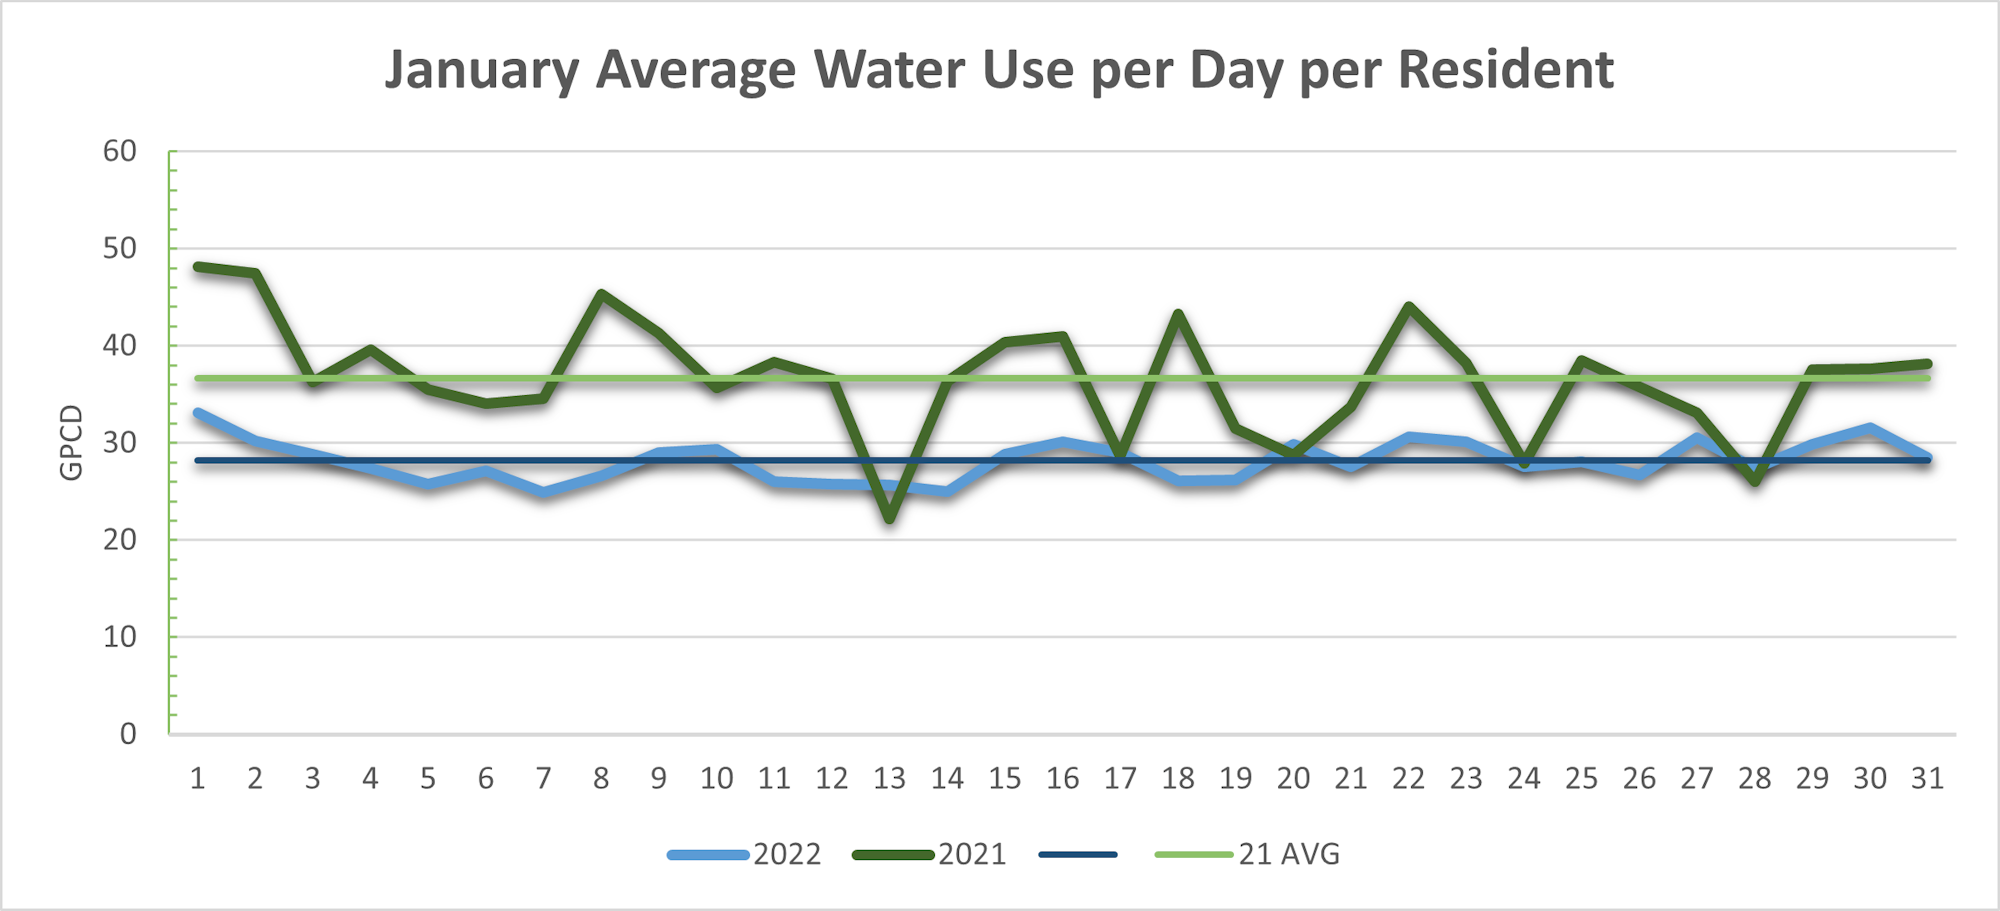
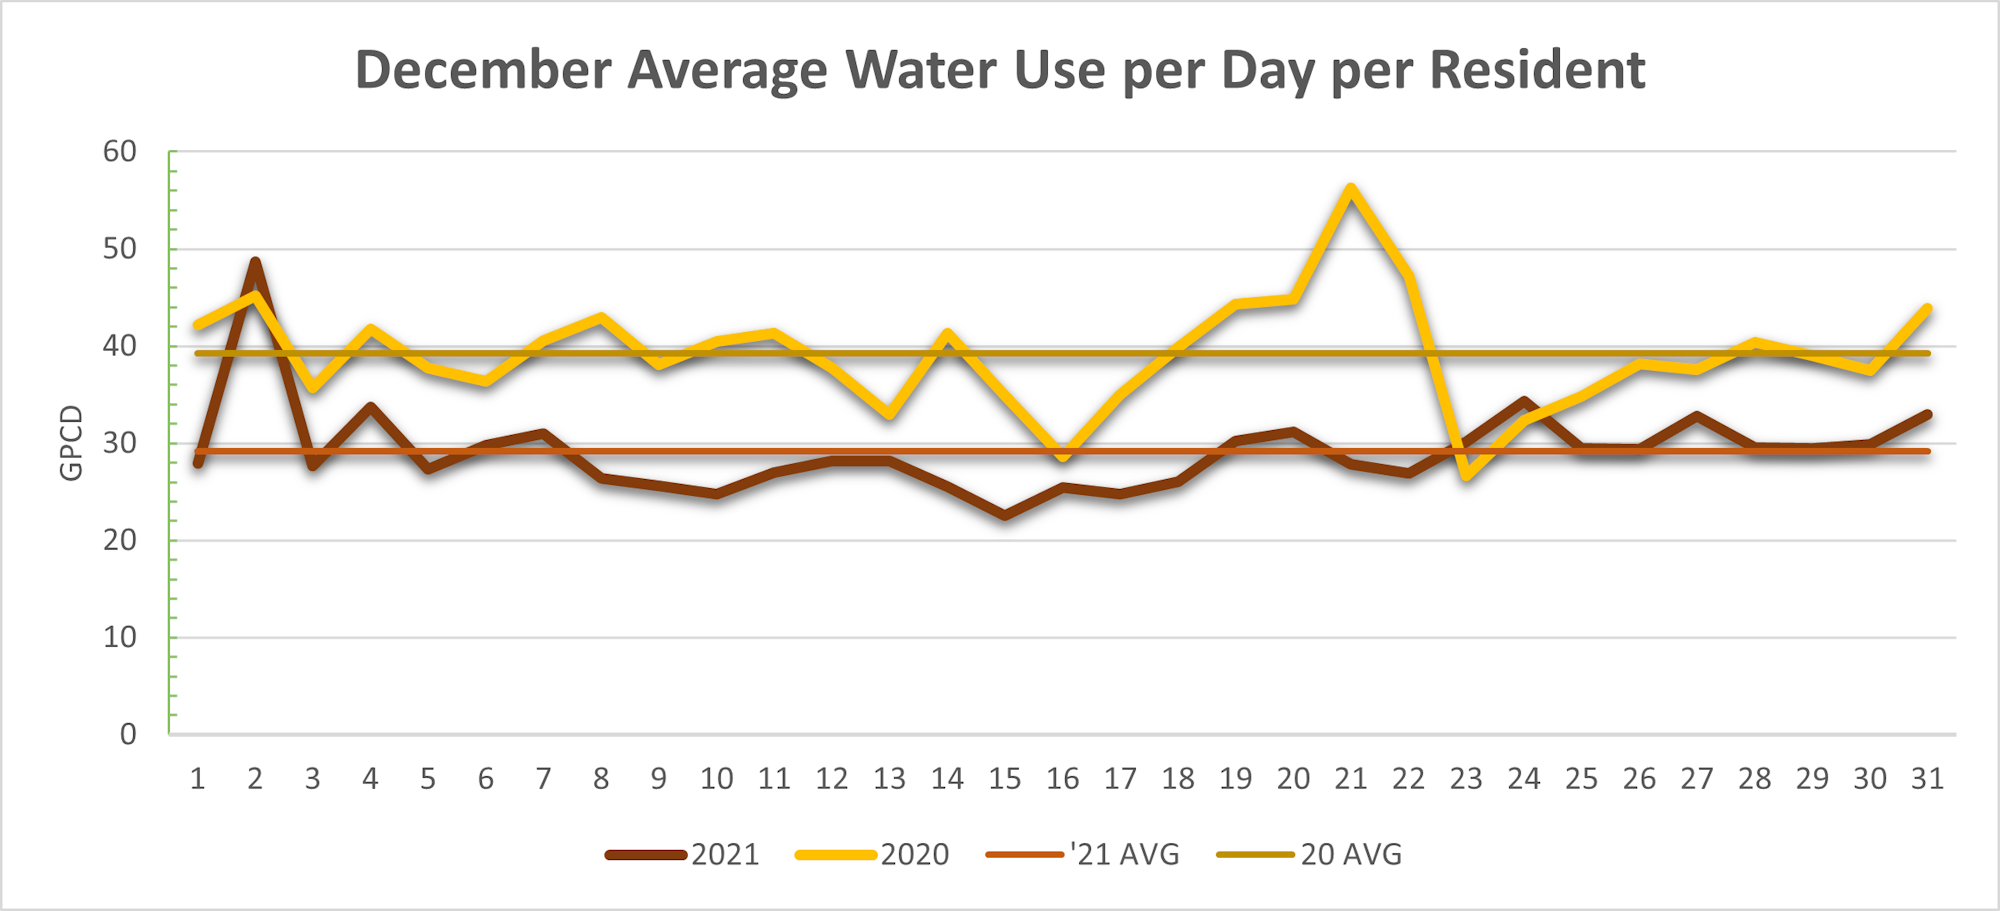
As you can see, water consumption over the past few months has averaged about 10 GPCD less than the year prior. February's consumption trends are more consistent year-over-year, which may be signaling a lull in water conscious behavior in the community. Even so, water consumption in Cambria continues to be incredibly efficient, averaging 31 GPCD so far this month.
It's very likely that CCSD customers who opted for a Flume device are already more water conscious than the community at-large, so these figures are likely better than true system averages. Water demand modeling performed during the preparation of the 2020 Urban Water Management Plan indicated that average single family residential water consumption was closer to 45 GPCD.
How Does Cambria Compare?

Water use varies depending on the location and type of water year. The State Water Resources Control Board collects monthly water use data from urban water suppliers, including Cambria, to compare consumption rates throughout the state and within hydrologic regions. Cambria falls in the Central Coast region, which averaged 73 GPCD in 2021. Statewide, consumption in 2021 averaged 91 GPCD.
2021 consumption trends were actually more conservative than in the historic drought year of 2014. Many in the water industry believe that Californians have adapted to a “new normal” when it comes to water use in their homes and gardens. The State of California has passed legislation to make “Water Use Efficiency a California Way of Life” and is considering indoor water use standards as low as 42 GPCD by 2030.
Don't sweat it, Cambria. You're already exceeding that goal. Keep up the good work!
What Do You Want to Know?
This blog has been created to provide a deeper dive into water conservation and water use efficiency topics between regular board meetings when the Utilities Department Manager gives his monthly report. Let us know what you'd like to read in the future by completing a survey here.
This post authored by Melissa Bland, Program Manager